Archiwum kategorii: Design

What Jazz Improvisation Teaches About Design

Post pobrano z: What Jazz Improvisation Teaches About Design

At first glance, jazz and design seem to have little in common. One is a musical form defined by spontaneous creativity. The other is a disciplined practice of problem-solving and visual communication. But look closer, and the parallels are striking. Jazz improvisation is a masterclass in working within constraints, responding to context, and trusting your instincts. It is a model for creative practice.

The Structure Beneath the Spontaneity

Jazz improvisation is not freeform chaos. It is built on a framework of chord progressions, scales, and rhythmic patterns. The musician knows the structure, understands the rules, and uses that knowledge to create something new.

The same is true for design. A successful design is not a random collection of visual elements. It is built on a framework of principles, constraints, and goals. The designer knows the structure, understands the rules, and uses that knowledge to create something new. The improvisation is not a rejection of structure. It is a dialogue with it.

The Art of Listening

Jazz is a conversation. The musician listens to the other players, responds to their cues, and builds on their ideas. The music is not created in isolation. It is created in dialogue.

The same is true for design. A designer who does not listen to the client, the user, or the context is a designer who is working in isolation. The best design is the result of a dialogue: between the designer and the brief, between the form and the function, between the vision and the constraints.

The improvisation is not a monologue. It is a response.

The Courage to Make Mistakes

Jazz improvisation involves risk. The musician plays a note that is outside the expected scale, a phrase that does not resolve cleanly. The risk is that the note will sound wrong. The reward is that the note will sound new.

The same is true for design. A designer who plays it safe, who follows the expected path, will produce work that is competent but predictable. A designer who takes risks, who tries something unexpected, will produce work that is surprising and memorable. The risk is that the design will fail. The reward is that it will succeed in a way that no one expected.

The Role of Repetition

Jazz improvisation is not always about novelty. The musician returns to familiar phrases, repeats a rhythmic pattern, builds on a theme. The repetition is not a lack of creativity. It is a way of creating structure, of giving the listener something to hold onto.

The same is true for design. A designer who reinvents the wheel for every project is a designer who is wasting time. A designer who builds on existing solutions, who adapts and refines, is a designer who is working efficiently. The repetition is not a lack of creativity. It is a way of building consistency.

The Bottom Line

Jazz improvisation teaches us that creativity is not about breaking the rules. It is about understanding them well enough to play with them. It teaches us to listen, to respond, and to take risks. It teaches us that the structure is not a limitation. It is a foundation.

The next time you sit down to design something, think about the jazz musician. Think about the structure. Think about the dialogue. Think about the risk. The improvisation is not a rejection of the rules. It is a conversation with them. The improvisation is not a moment of chaos. It is a moment of clarity. The improvisation is not a departure from the craft. It is the craft, at its most alive.

The post What Jazz Improvisation Teaches About Design appeared first on Designer Daily: graphic and web design blog.

The Trend I Hoped Would Die (But Didn’t)

Post pobrano z: The Trend I Hoped Would Die (But Didn’t)

It started as a quiet irritation, a minor visual tic. I saw it in a logo, a poster, a website, and I thought it was a mistake. The letters were overlapping, the lines were breaking, the boundaries were dissolving. It was a new kind of visual style, and I did not like it. I assumed it was a passing fad. I waited for it to fade. It did not. The trend I hoped would die kept showing up, in more places, with more confidence, and eventually, I realized it was not going anywhere.

The Trend That Refused to Fade

The trend was the deliberate use of visual distortion, of breaking the rules of legibility and clarity. It was the use of “vaporwave,” “Y2K,” and “dirty” design. It was the revival of early internet aesthetics, the embrace of “digital decay” as a deliberate style. It felt like a step backward, a rejection of the craftsmanship and clarity that I valued.

I was not alone in my dislike. I was not alone in my hope that it would disappear. There was a small group of designers who shared my frustration. We exchanged articles, examples, and complaints. We were convinced that the trend was a sign of decline, a loss of standards, a failure of taste.

But the trend persisted. It grew. It evolved. It became more sophisticated. It moved from the margins to the mainstream. It appeared in advertising, fashion, and even in the branding of established companies. I could no longer dismiss it as a temporary aberration. It had become a significant part of the visual language.

The Realization

The turning point came when I realized that my dislike of the trend was not a criticism of the trend. It was a criticism of my own assumptions. I had assumed that good design had to be clear, legible, and polished. I had assumed that the role of the designer was to remove friction, not to create it.

The trend that I hoped would die was not a rejection of design. It was a rejection of my definition of design. It was a reminder that visual communication is not a single language, but a family of dialects. It was a reminder that the rules of design are not universal truths. They are conventions that change over time.

The trend that I hoped would die was not a failure. It was a provocation. It challenged me to think about design differently. It pushed me to consider the value of imperfection, the power of nostalgia, and the role of emotional resonance in design.

The Lesson

The lesson was not to embrace every trend. The lesson was to recognize that design is not about following the rules. It is about understanding them well enough to decide when to break them. The trend that I hoped would die was a reminder that design is a conversation. It is a dialogue between the designer, the audience, and the culture. Trends are not good or bad. They are responses to the cultural conditions in which they emerge. They are signs of what people are thinking, feeling, and wanting.

The designer who dismisses a trend without understanding it is the designer who has stopped learning. The designer who studies a trend, even one they dislike, is the designer who continues to grow. Trends are not just visual styles. They are cultural signals. They tell you what people are paying attention to. They are worth listening to.

The Bottom Line

The trend I hoped would die did not die. It taught me something. It taught me to be more curious and less certain. It taught me that my job is not to judge trends but to understand them. The designer who can see the value in what they do not like is the designer who will continue to evolve. The trend is not a threat. It is an opportunity. It is a chance to learn something new, to see the world differently, and to grow.

The trend that refused to die was not a failure. It was a lesson. It was a reminder that design is not about being right. It is about being open. The trend I hoped would die did not die. It made me a better designer. It showed me that the best way to deal with something you do not like is not to ignore it, but to understand it.

The post The Trend I Hoped Would Die (But Didn’t) appeared first on Designer Daily: graphic and web design blog.

5 Best GEO Agencies for AI Search Competitive Analysis

Post pobrano z: 5 Best GEO Agencies for AI Search Competitive Analysis

AI search is creating a new competitive landscape for brands. A company may outperform rivals in Google while appearing far less often in ChatGPT, Gemini, Perplexity, or other generative platforms.

That makes competitive analysis an important part of generative engine optimization (GEO).

Brands need to understand which competitors are appearing, what prompts trigger those recommendations, which sources support them, and where their own visibility is weakest.

Here are five of the best AI search optimization companies, specifically for AI search competitive analysis.

1. Profound

Profound is a strong option for brands that want detailed competitive intelligence across AI search.

Its platform can compare brands by visibility, citations, share of voice, sentiment, and prompt-level performance across major generative platforms. It can also surface competitors based on who is actually winning citations rather than relying only on a predefined competitor list.

That can reveal competitors traditional SEO tools may overlook.

For example, a company may discover that a smaller brand appears frequently for high-value AI prompts because it has stronger content around a specific use case.

For internal teams with the resources to act on detailed data, Profound can provide a useful competitive benchmarking layer.

2. iPullRank

iPullRank is a strong fit for companies that want competitive analysis connected to technical and content strategy.

A visibility gap may not be caused by one missing article. Competitors may have stronger information architecture, clearer entity relationships, better supporting content, or more authority around an important topic.

iPullRank can help companies investigate those deeper differences.

This can be especially useful for enterprise organizations where large websites make it difficult to determine why one competitor consistently receives stronger generative visibility.

3. NP Digital

NP Digital is a strong choice for brands that want competitive GEO research translated into a practical marketing plan.

The most useful competitive analysis should answer more than who is winning. It should explain what the winning brands are doing differently.

NP Digital can examine the topics competitors are associated with, where they appear during recommendation and comparison searches, and which parts of the buyer journey the client is currently missing.

Those findings can then shape SEO, content, digital PR, and positioning priorities.

A competitor’s advantage might come from stronger comparison resources. Another may receive more recognition from relevant third-party publications. In other cases, the issue may be that the brand’s own positioning is too broad.

For companies that want competitive intelligence connected directly to execution, that cross-channel approach can be valuable.

4. Omnius

Omnius is a good option for SaaS, fintech, and technology brands that want focused GEO competitor analysis.

Its specialized approach can help companies monitor how frequently competitors appear for important categories, recommendations, alternatives, and use cases.

This can help internal teams identify where a rival is gaining visibility that traditional rankings do not fully explain.

For companies with existing SEO and content resources, Omnius can provide a more targeted AI search perspective without requiring a larger full-service engagement.

5. Reboot Online

Reboot Online is particularly useful when competitive analysis reveals an authority gap.

Sometimes competitors appear more prominently because they are referenced more frequently across credible third-party sources.

Reboot Online’s digital PR expertise can help companies address that problem through original research, expert commentary, and relevant media coverage.

For GEO, those efforts can strengthen the broader information environment surrounding the brand and help it compete beyond its own website.

What AI Search Competitive Analysis Should Measure

Competitive GEO analysis should focus on meaningful prompts rather than raw mention counts.

Companies should compare visibility across category searches, recommendation prompts, alternatives, use cases, and direct competitor comparisons.

Citation analysis can reveal which sources appear repeatedly alongside winning brands.

Teams should also review how competitors are described.

A brand may appear frequently while still being positioned poorly, so visibility and message quality should be evaluated together.

Choosing the Right GEO Agency

The best partner should help companies understand why competitors are winning and what can realistically be done about it.

Some brands need stronger content. Others need technical improvements, clearer positioning, or more third-party authority.

A strong GEO agency will turn competitive analysis into a prioritized strategy rather than simply another dashboard.

The post 5 Best GEO Agencies for AI Search Competitive Analysis appeared first on Designer Daily: graphic and web design blog.

Why Your Phone Is Too Big for Your Hand

Post pobrano z: Why Your Phone Is Too Big for Your Hand

The phone in your pocket is a remarkable piece of engineering. It is a computer, a camera, a cinema, and a library, all compressed into a slab of metal and glass. But despite this technological marvel, there is a fundamental flaw: for many of us, our phones have become too big for our hands. The screen keeps growing, but our hands have not changed.

The Simple Reason: Our Hands Haven’t Grown

Smartphones have become undeniably larger over the years . There are several reasons for this. The push toward mobile internet and video consumption has made larger screens more desirable . A bigger phone allows for a larger battery, and for manufacturers, a larger device can often command a higher price .

However, the physical dimensions of our hands remain unchanged. An old NASA study cited by experts suggests that the average hand breadth (the width of your palm) is about 3.5 inches for men and 3.1 inches for women . The average thumb length is around 2.74 inches for men and 2.49 inches for women . When a phone’s width exceeds this comfortable reach, it becomes a struggle to use one-handed. You have to stretch your thumb uncomfortably, constantly adjust your grip, or simply concede defeat and use two hands.

What “Too Big” Feels Like

You know your phone is too big when the simple act of using it becomes a physical compromise. The most immediate discomfort is thumb strain. When you have to stretch your thumb across a large screen to reach the far side, it creates tension in the hand and wrist. This leads to a constant shifting of the phone’s position in your hand, a “grip shuffle,” which can feel precarious and tiring. The phone often becomes a “two-hand device” for any task beyond a simple swipe .

There is also a stark contrast between how a phone fits. The feeling of a truly compact phone is often described as liberating . Users of phones like the iPhone 13 Mini or Samsung Galaxy S10e  recall the joy of a device that was easy to grip, fit comfortably in any pocket, and allowed effortless one-handed use . They felt like the phone was an extension of the hand, not an object to be wrestled with. The obsession with making phones thinner is a similar misstep; it doesn’t solve the fundamental problem of width and height. As one analyst put it, focusing on thinness is pointless; we should be asking for phones that are “short” again .

The Market’s Shift and the Case for Compact Phones

For years, consumers who wanted a small phone were forced to accept underpowered “value” models that lacked the best cameras or features . This is changing. There is a growing (though still niche) movement toward compact flagships. Brands like Google, vivo, and OnePlus have experimented with phones like the Pixel 10 Pro and OnePlus 13s, offering flagship performance in a smaller form factor . For many, a 6.3-inch screen is emerging as the “sweet spot,” offering enough screen space for most tasks while still being comfortable to use one-handed . It represents a balance between the ergonomics of a compact phone and the features of a high-end device .

The Trade-Off

It is a classic design compromise. Bigger screens are better for watching video, gaming, and productivity. They offer a more immersive experience and can make multitasking easier. But you sacrifice comfort, portability, and the ease of one-handed use . A smaller phone can’t fit a huge battery, and its keyboard is more cramped. However, for the vast majority of daily tasks, the difference is less about capability and more about comfort. As one writer put it, “you don’t need all that screen real estate” . The feeling of a phone that fits your hand properly is not about nostalgia. It is about pure, unadulterated comfort. And that, it turns out, is a feeling worth chasing.

The post Why Your Phone Is Too Big for Your Hand appeared first on Designer Daily: graphic and web design blog.

CRM Implementation: What Businesses Pay to Get Organized

Post pobrano z: CRM Implementation: What Businesses Pay to Get Organized

A CRM system is a significant investment. But most businesses budget for the software license and forget everything else. The real cost of getting organized includes consulting, data migration, customization, training, and ongoing support, often 2-3 times the license fee alone. Here’s what businesses actually pay in 2026.

The Licensing Landscape: What Software Costs

CRM license pricing varies dramatically by platform and feature tier:

  • Salesforce leads the enterprise market with clear tiers: Starter at $25/user/month, Professional at $80, Enterprise at $165, and Unlimited+ at $330. Einstein AI adds $50/user/month on top of Professional or Enterprise. For a 10-person team on Enterprise with AI, annual licensing alone hits $25,800.
  • SAP Sales Cloud V2 typically costs $60–80/user/month, making it more competitive than Salesforce for feature parity. Volume discounts apply for 50+ users with multi-year commitments.
  • HubSpot ranges from free tools to $150/user/month for Enterprise, with mid-tier Professional at around $50–90 depending on features.
  • Microsoft Dynamics 365 Sales runs $65–162/user/month, climbing fast with add-ons.

A 50-user mid-market company on Salesforce Enterprise Edition pays approximately $105,000 per year in licensing alone before any implementation costs.

Implementation: The One-Time Investment

The license is the floor, not the ceiling. Implementation costs typically match or exceed first-year license fees.

By Business Size

Small businesses with 1-10 users pay $10,000–50,000 for implementation over 4-8 weeks. Growing SMBs with 10-50 users invest $50,000–150,000 over 2-4 months. Mid-market companies with 50-200 users spend $75,000–250,000 across 4-6 months. Enterprise deployments with 200+ users routinely exceed $150,000–500,000+ over 6-12 months.

What Implementation Includes

A standard implementation covers discovery and requirements workshops, system configuration (pipelines, territories, user roles, dashboards), integration setup, data migration, user acceptance testing, training, and go-live support.

For SAP Sales Cloud V2, a standard 8-16 week implementation for a mid-market company runs $40,000–120,000. Enterprise rollouts with 100+ users, multiple business units, and custom development typically cost $150,000–400,000+ over 3-6 months.

For Zoho implementations, costs range from $2,500–7,500 for basic setups to $20,000–75,000 for enterprise solutions.

The Hidden Costs That Break Budgets

Most businesses underestimate CRM costs by 40-80% because they overlook these line items:

  • Data migration and cleansing is the most common surprise. Duplicate contacts, inconsistent naming, missing fields, these problems exist in every source system. Budget 10-20% of implementation cost for data work. Skipping this means importing garbage into a clean system.
  • Customization costs add up quickly. Salesforce custom work (Apex, LWCs) runs $100–200/hour, with full custom builds exceeding $85,000. SAP’s plug-in framework development adds similar costs for complex requirements.
  • Integrations are frequently underestimated. Basic connectors cost $10,000–50,000, while complex enterprise integrations can reach $100,000+. For SAP ERP shops, native integration saves $20,000–50,000/year versus third-party CRM with middleware.
  • AppExchange add-ons catch many Salesforce buyers off guard. Features like advanced reporting, deduplication, document management, and e-signatures require paid apps, each with its own monthly fee.
  • Sandbox environments for development and testing cost extra, especially for organizations running multiple development cycles simultaneously. Data storage overages add approximately $125/month per 500MB beyond included limits.
  • Training and change management is where most projects cut corners, and where they fail. A CRM only works if people use it. Budget $5,000–15,000 for mid-market deployments. The cost of not doing this: low adoption, inaccurate data, and sales reps reverting to spreadsheets.
  • Post-launch support typically runs $10,000–45,000 annually. Premier Support from Salesforce adds roughly 30% to license fees. Many businesses also need a dedicated administrator, a full-time role with salaries from $70,000–120,000+ per year.

Real-World Total Cost Examples

Small business, 10 users on Salesforce Professional:
Licenses: $9,600/year. Implementation: $15,000–25,000. Training: $3,000. AppExchange add-ons: $2,400/year. Year 1 total: approximately $30,000–40,000.

Mid-market, 50 users on SAP Sales Cloud V2:
Licenses: $42,000–48,000/year. Standard implementation: $40,000–120,000. S/4HANA integration (if applicable): $20,000–50,000/year saved versus third-party CRM. Year 1 total: $82,000–168,000.

Enterprise, 200+ users on Salesforce Unlimited:
Licenses: $330/user/month = $792,000/year. Implementation: $150,000–500,000+. Integrations: $50,000–100,000. Admin team: $140,000–240,000/year. Premier Support: ~$240,000/year. Year 1 total easily exceeds $1.5 million.

Strategies to Control Costs

Phase your rollout. Start with core use cases, then iterate. A 10-person agency doesn’t need territory management or CPQ.

Use declarative tools before custom code. Salesforce’s Flows and SAP’s standard configurations handle most needs without expensive development.

Optimize license mix. Give higher tiers to power users, lower-cost licenses to light users. Not everyone needs Enterprise.

Consider industry-specific solutions. For financial brokerages, white-label platforms like B2CORE reduce time-to-launch by 60-70% compared to custom builds, with pre-built compliance modules for KYC, AML, and trading integrations.

Get a fixed-price scope for well-defined deliverables. For evolving requirements, time and materials offers flexibility but requires tight governance.

The Bottom Line

CRM implementation is not a software purchase. It’s a business transformation. The organizations that budget realistically, planning for data migration, training, integration, and ongoing support, succeed. Those that focus only on the license price fail.

A reliable rule of thumb: budget 40-80% above your license cost for true Year 1 total cost of ownership. If you’re spending $60,000 on licenses, your real Year 1 cost is likely $84,000–108,000 when everything is factored in. Plan accordingly, and your CRM will deliver the ROI you’re expecting.

The post CRM Implementation: What Businesses Pay to Get Organized appeared first on Designer Daily: graphic and web design blog.

CRM Implementation: What Businesses Pay to Get Organized

Post pobrano z: CRM Implementation: What Businesses Pay to Get Organized

A CRM system is a significant investment. But most businesses budget for the software license and forget everything else. The real cost of getting organized includes consulting, data migration, customization, training, and ongoing support, often 2-3 times the license fee alone. Here’s what businesses actually pay in 2026.

The Licensing Landscape: What Software Costs

CRM license pricing varies dramatically by platform and feature tier:

  • Salesforce leads the enterprise market with clear tiers: Starter at $25/user/month, Professional at $80, Enterprise at $165, and Unlimited+ at $330. Einstein AI adds $50/user/month on top of Professional or Enterprise. For a 10-person team on Enterprise with AI, annual licensing alone hits $25,800.
  • SAP Sales Cloud V2 typically costs $60–80/user/month, making it more competitive than Salesforce for feature parity. Volume discounts apply for 50+ users with multi-year commitments.
  • HubSpot ranges from free tools to $150/user/month for Enterprise, with mid-tier Professional at around $50–90 depending on features.
  • Microsoft Dynamics 365 Sales runs $65–162/user/month, climbing fast with add-ons.

A 50-user mid-market company on Salesforce Enterprise Edition pays approximately $105,000 per year in licensing alone before any implementation costs.

Implementation: The One-Time Investment

The license is the floor, not the ceiling. Implementation costs typically match or exceed first-year license fees.

By Business Size

Small businesses with 1-10 users pay $10,000–50,000 for implementation over 4-8 weeks. Growing SMBs with 10-50 users invest $50,000–150,000 over 2-4 months. Mid-market companies with 50-200 users spend $75,000–250,000 across 4-6 months. Enterprise deployments with 200+ users routinely exceed $150,000–500,000+ over 6-12 months.

What Implementation Includes

A standard implementation covers discovery and requirements workshops, system configuration (pipelines, territories, user roles, dashboards), integration setup, data migration, user acceptance testing, training, and go-live support.

For SAP Sales Cloud V2, a standard 8-16 week implementation for a mid-market company runs $40,000–120,000. Enterprise rollouts with 100+ users, multiple business units, and custom development typically cost $150,000–400,000+ over 3-6 months.

For Zoho implementations, costs range from $2,500–7,500 for basic setups to $20,000–75,000 for enterprise solutions.

The Hidden Costs That Break Budgets

Most businesses underestimate CRM costs by 40-80% because they overlook these line items:

  • Data migration and cleansing is the most common surprise. Duplicate contacts, inconsistent naming, missing fields, these problems exist in every source system. Budget 10-20% of implementation cost for data work. Skipping this means importing garbage into a clean system.
  • Customization costs add up quickly. Salesforce custom work (Apex, LWCs) runs $100–200/hour, with full custom builds exceeding $85,000. SAP’s plug-in framework development adds similar costs for complex requirements.
  • Integrations are frequently underestimated. Basic connectors cost $10,000–50,000, while complex enterprise integrations can reach $100,000+. For SAP ERP shops, native integration saves $20,000–50,000/year versus third-party CRM with middleware.
  • AppExchange add-ons catch many Salesforce buyers off guard. Features like advanced reporting, deduplication, document management, and e-signatures require paid apps, each with its own monthly fee.
  • Sandbox environments for development and testing cost extra, especially for organizations running multiple development cycles simultaneously. Data storage overages add approximately $125/month per 500MB beyond included limits.
  • Training and change management is where most projects cut corners, and where they fail. A CRM only works if people use it. Budget $5,000–15,000 for mid-market deployments. The cost of not doing this: low adoption, inaccurate data, and sales reps reverting to spreadsheets.
  • Post-launch support typically runs $10,000–45,000 annually. Premier Support from Salesforce adds roughly 30% to license fees. Many businesses also need a dedicated administrator, a full-time role with salaries from $70,000–120,000+ per year.

Real-World Total Cost Examples

Small business, 10 users on Salesforce Professional:
Licenses: $9,600/year. Implementation: $15,000–25,000. Training: $3,000. AppExchange add-ons: $2,400/year. Year 1 total: approximately $30,000–40,000.

Mid-market, 50 users on SAP Sales Cloud V2:
Licenses: $42,000–48,000/year. Standard implementation: $40,000–120,000. S/4HANA integration (if applicable): $20,000–50,000/year saved versus third-party CRM. Year 1 total: $82,000–168,000.

Enterprise, 200+ users on Salesforce Unlimited:
Licenses: $330/user/month = $792,000/year. Implementation: $150,000–500,000+. Integrations: $50,000–100,000. Admin team: $140,000–240,000/year. Premier Support: ~$240,000/year. Year 1 total easily exceeds $1.5 million.

Strategies to Control Costs

Phase your rollout. Start with core use cases, then iterate. A 10-person agency doesn’t need territory management or CPQ.

Use declarative tools before custom code. Salesforce’s Flows and SAP’s standard configurations handle most needs without expensive development.

Optimize license mix. Give higher tiers to power users, lower-cost licenses to light users. Not everyone needs Enterprise.

Consider industry-specific solutions. For financial brokerages, white-label platforms like B2CORE reduce time-to-launch by 60-70% compared to custom builds, with pre-built compliance modules for KYC, AML, and trading integrations.

Get a fixed-price scope for well-defined deliverables. For evolving requirements, time and materials offers flexibility but requires tight governance.

The Bottom Line

CRM implementation is not a software purchase. It’s a business transformation. The organizations that budget realistically, planning for data migration, training, integration, and ongoing support, succeed. Those that focus only on the license price fail.

A reliable rule of thumb: budget 40-80% above your license cost for true Year 1 total cost of ownership. If you’re spending $60,000 on licenses, your real Year 1 cost is likely $84,000–108,000 when everything is factored in. Plan accordingly, and your CRM will deliver the ROI you’re expecting.

The post CRM Implementation: What Businesses Pay to Get Organized appeared first on Designer Daily: graphic and web design blog.

Facebook Ads Creative: Designing Visuals That Actually Convert

Post pobrano z: Facebook Ads Creative: Designing Visuals That Actually Convert

A stunning ad doesn’t matter if no one stops scrolling. In 2026, the Facebook algorithm has fundamentally changed: creative doesn’t just attract attention, it is the targeting. Meta’s Andromeda algorithm now reads your visuals, audio, and captions to determine who should see your ad. Feed it the wrong signals, and your costs skyrocket. Feed it the right ones, and your ROI follows.

Here’s how to design Facebook ads that convert across every placement.

The Algorithm Has Changed: Creative = Targeting

Historically, you picked an audience first, then designed an ad for them. In 2026, that model is dead. Meta’s AI now analyzes your creative assets directly, interpreting visual cues, sounds, and text to decide who gets served the ad.

If you’re selling hiking boots, your ad needs to show a trail, mud, or a boot in action. The AI reads those signals. If your ad is a generic product shot on white, the algorithm has no idea who to show it to, and your CPMs will rise.

The rule: design for the algorithm’s vision, not just human eyes.

1. Feed Ads: The High-Intent Workhorse

Facebook and Instagram Feeds remain the most stable, high-volume placements. They excel at both branding and direct conversion because they allow for deeper storytelling and clear calls-to-action.

What works in 2026:

Authentic, “Ugly” Creatives. Polished, studio-shot ads are getting filtered out. Ads that look like organic content (lo-fi video, user-generated footage, founder selfies) are bypassing mental ad-blockers. One demand gen pro noted that “ugly ads” that appear platform-native often see dramatically higher CTRs because they don’t trigger the viewer’s internal “this is an ad” alarm.

Carousels are back. Instead of one image, use 3-10 cards to tell a story or showcase multiple products. Meta’s current trends show carousels performing very well, particularly for e-commerce.

Text-heavy statics. Don’t sleep on static images. They still drive 60-70% of conversions on Meta. A bold, text-only graphic that states a clear problem/solution can outperform a video if the hook is strong enough.

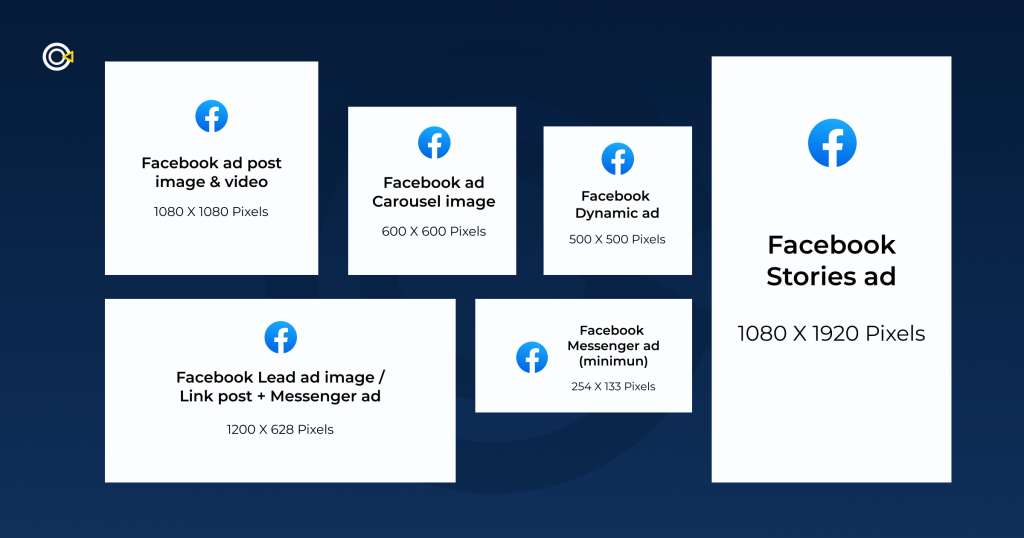
Specs: 1:1 (1080×1080) or 4:5 (1080×1350). Keep critical text away from the bottom 15% (where the action buttons sit).

2. Reels & Short-Form Video: The Discovery Engine

Short-form video is no longer just for “brand awareness.” With YouTube Shorts hitting billions of views and Instagram prioritizing Reels, this format is now a full-funnel performance driver.

What works in 2026:

The “Hook” is visual. You have 1-3 seconds to stop the scroll. Do not start with a logo fade-in. Start with a visual question, a surprising result, or a person talking directly to the camera.

Platform-native pacing. Don’t export a horizontal TV ad and crop it. Shoot vertically, use captions (sound off is default for many), and embrace fast cuts. The content should blend into the feed, not interrupt it.

Founder-led content. People trust people, not brands. Videos featuring a founder or an employee explaining a product’s “why” are generating up to 25% more leads than faceless corporate animations.

Specs: 9:16 (1080×1920). Duration: 15-60 seconds is the sweet spot. Text must be in the “safe zone” (center 80% of the frame) to avoid being covered by the like/comment buttons or profile icons.

3. Stories & Reels: The Full-Screen Immersion

Stories (and Reels placements) offer a full-screen, distraction-free environment. Because users tap through them quickly, you have about 5 seconds to convey your value proposition before they swipe away.

What works in 2026:

Vertical-First Design. Never run a horizontal letterboxed video here. It breaks the immersion. Use the full 9:16 canvas.

Dynamic Elements. Use stickers, polls, or countdown timers. In Stories, interactivity stops the swipe. A poll about a pain point engages the user immediately.

Sound & Silence. Since many users browse in public, design your Story to be understood with captions, but use trending audio to boost reach when sound is on.

Testing: Finding Your Winner (Without Wasting Budget)

Even the best hypothesis needs validation. With creative driving 56% of campaign outcomes, a systematic testing approach is non-negotiable.

1. Use Advantage+ Creative (AAC).
Don’t just upload one image. Meta’s AI can now generate multiple text variations, adjust brightness, and even animate static images. Turn on Advantage+ Creative to let the algorithm serve the best combination to the right user. Studies show this can increase sales by 1.2x to 7.4x.

2. Dynamic Creative (DCO).
Upload 3-5 headlines, 3 images/videos, and 2 descriptions. Meta will mix and match them in real-time to find the winning combo. This is more efficient than running 10 separate manual ads.

3. The “Big Swing” Test.
Don’t test red vs. blue buttons. Test Video vs. Static or Problem-focused vs. Benefit-focused. Make the differences obvious so the data is conclusive.

Key Takeaways

  • Creative is the new targeting. Diversify your assets (images, short video, carousels) to give the AI enough data to find your customers.
  • Authenticity beats production value. User-generated content and founder-led videos build trust faster than polished commercials.
  • Optimize by placement. An ad that works in the Feed will fail in Stories if it’s not 9:16. Use the platform tools to customize aspect ratios per placement.
  • Let AI do the heavy lifting. Use Dynamic Creative and Advantage+ to automate testing, but always keep human oversight on the final brand message.

In 2026, the brands that win are not the ones with the biggest budgets, they are the ones with the smartest creative systems. Design for the algorithm, test relentlessly, and let authentic visuals lead the way.

The post Facebook Ads Creative: Designing Visuals That Actually Convert appeared first on Designer Daily: graphic and web design blog.

Facebook Ads Creative: Designing Visuals That Actually Convert

Post pobrano z: Facebook Ads Creative: Designing Visuals That Actually Convert

A stunning ad doesn’t matter if no one stops scrolling. In 2026, the Facebook algorithm has fundamentally changed: creative doesn’t just attract attention, it is the targeting. Meta’s Andromeda algorithm now reads your visuals, audio, and captions to determine who should see your ad. Feed it the wrong signals, and your costs skyrocket. Feed it the right ones, and your ROI follows.

Here’s how to design Facebook ads that convert across every placement.

The Algorithm Has Changed: Creative = Targeting

Historically, you picked an audience first, then designed an ad for them. In 2026, that model is dead. Meta’s AI now analyzes your creative assets directly, interpreting visual cues, sounds, and text to decide who gets served the ad.

If you’re selling hiking boots, your ad needs to show a trail, mud, or a boot in action. The AI reads those signals. If your ad is a generic product shot on white, the algorithm has no idea who to show it to, and your CPMs will rise.

The rule: design for the algorithm’s vision, not just human eyes.

1. Feed Ads: The High-Intent Workhorse

Facebook and Instagram Feeds remain the most stable, high-volume placements. They excel at both branding and direct conversion because they allow for deeper storytelling and clear calls-to-action.

What works in 2026:

Authentic, “Ugly” Creatives. Polished, studio-shot ads are getting filtered out. Ads that look like organic content (lo-fi video, user-generated footage, founder selfies) are bypassing mental ad-blockers. One demand gen pro noted that “ugly ads” that appear platform-native often see dramatically higher CTRs because they don’t trigger the viewer’s internal “this is an ad” alarm.

Carousels are back. Instead of one image, use 3-10 cards to tell a story or showcase multiple products. Meta’s current trends show carousels performing very well, particularly for e-commerce.

Text-heavy statics. Don’t sleep on static images. They still drive 60-70% of conversions on Meta. A bold, text-only graphic that states a clear problem/solution can outperform a video if the hook is strong enough.

Specs: 1:1 (1080×1080) or 4:5 (1080×1350). Keep critical text away from the bottom 15% (where the action buttons sit).

2. Reels & Short-Form Video: The Discovery Engine

Short-form video is no longer just for “brand awareness.” With YouTube Shorts hitting billions of views and Instagram prioritizing Reels, this format is now a full-funnel performance driver.

What works in 2026:

The “Hook” is visual. You have 1-3 seconds to stop the scroll. Do not start with a logo fade-in. Start with a visual question, a surprising result, or a person talking directly to the camera.

Platform-native pacing. Don’t export a horizontal TV ad and crop it. Shoot vertically, use captions (sound off is default for many), and embrace fast cuts. The content should blend into the feed, not interrupt it.

Founder-led content. People trust people, not brands. Videos featuring a founder or an employee explaining a product’s “why” are generating up to 25% more leads than faceless corporate animations.

Specs: 9:16 (1080×1920). Duration: 15-60 seconds is the sweet spot. Text must be in the “safe zone” (center 80% of the frame) to avoid being covered by the like/comment buttons or profile icons.

3. Stories & Reels: The Full-Screen Immersion

Stories (and Reels placements) offer a full-screen, distraction-free environment. Because users tap through them quickly, you have about 5 seconds to convey your value proposition before they swipe away.

What works in 2026:

Vertical-First Design. Never run a horizontal letterboxed video here. It breaks the immersion. Use the full 9:16 canvas.

Dynamic Elements. Use stickers, polls, or countdown timers. In Stories, interactivity stops the swipe. A poll about a pain point engages the user immediately.

Sound & Silence. Since many users browse in public, design your Story to be understood with captions, but use trending audio to boost reach when sound is on.

Testing: Finding Your Winner (Without Wasting Budget)

Even the best hypothesis needs validation. With creative driving 56% of campaign outcomes, a systematic testing approach is non-negotiable.

1. Use Advantage+ Creative (AAC).
Don’t just upload one image. Meta’s AI can now generate multiple text variations, adjust brightness, and even animate static images. Turn on Advantage+ Creative to let the algorithm serve the best combination to the right user. Studies show this can increase sales by 1.2x to 7.4x.

2. Dynamic Creative (DCO).
Upload 3-5 headlines, 3 images/videos, and 2 descriptions. Meta will mix and match them in real-time to find the winning combo. This is more efficient than running 10 separate manual ads.

3. The “Big Swing” Test.
Don’t test red vs. blue buttons. Test Video vs. Static or Problem-focused vs. Benefit-focused. Make the differences obvious so the data is conclusive.

Key Takeaways

  • Creative is the new targeting. Diversify your assets (images, short video, carousels) to give the AI enough data to find your customers.
  • Authenticity beats production value. User-generated content and founder-led videos build trust faster than polished commercials.
  • Optimize by placement. An ad that works in the Feed will fail in Stories if it’s not 9:16. Use the platform tools to customize aspect ratios per placement.
  • Let AI do the heavy lifting. Use Dynamic Creative and Advantage+ to automate testing, but always keep human oversight on the final brand message.

In 2026, the brands that win are not the ones with the biggest budgets, they are the ones with the smartest creative systems. Design for the algorithm, test relentlessly, and let authentic visuals lead the way.

The post Facebook Ads Creative: Designing Visuals That Actually Convert appeared first on Designer Daily: graphic and web design blog.

Restaurant Interior Design: Creating Spaces People Want to Photograph

Post pobrano z: Restaurant Interior Design: Creating Spaces People Want to Photograph

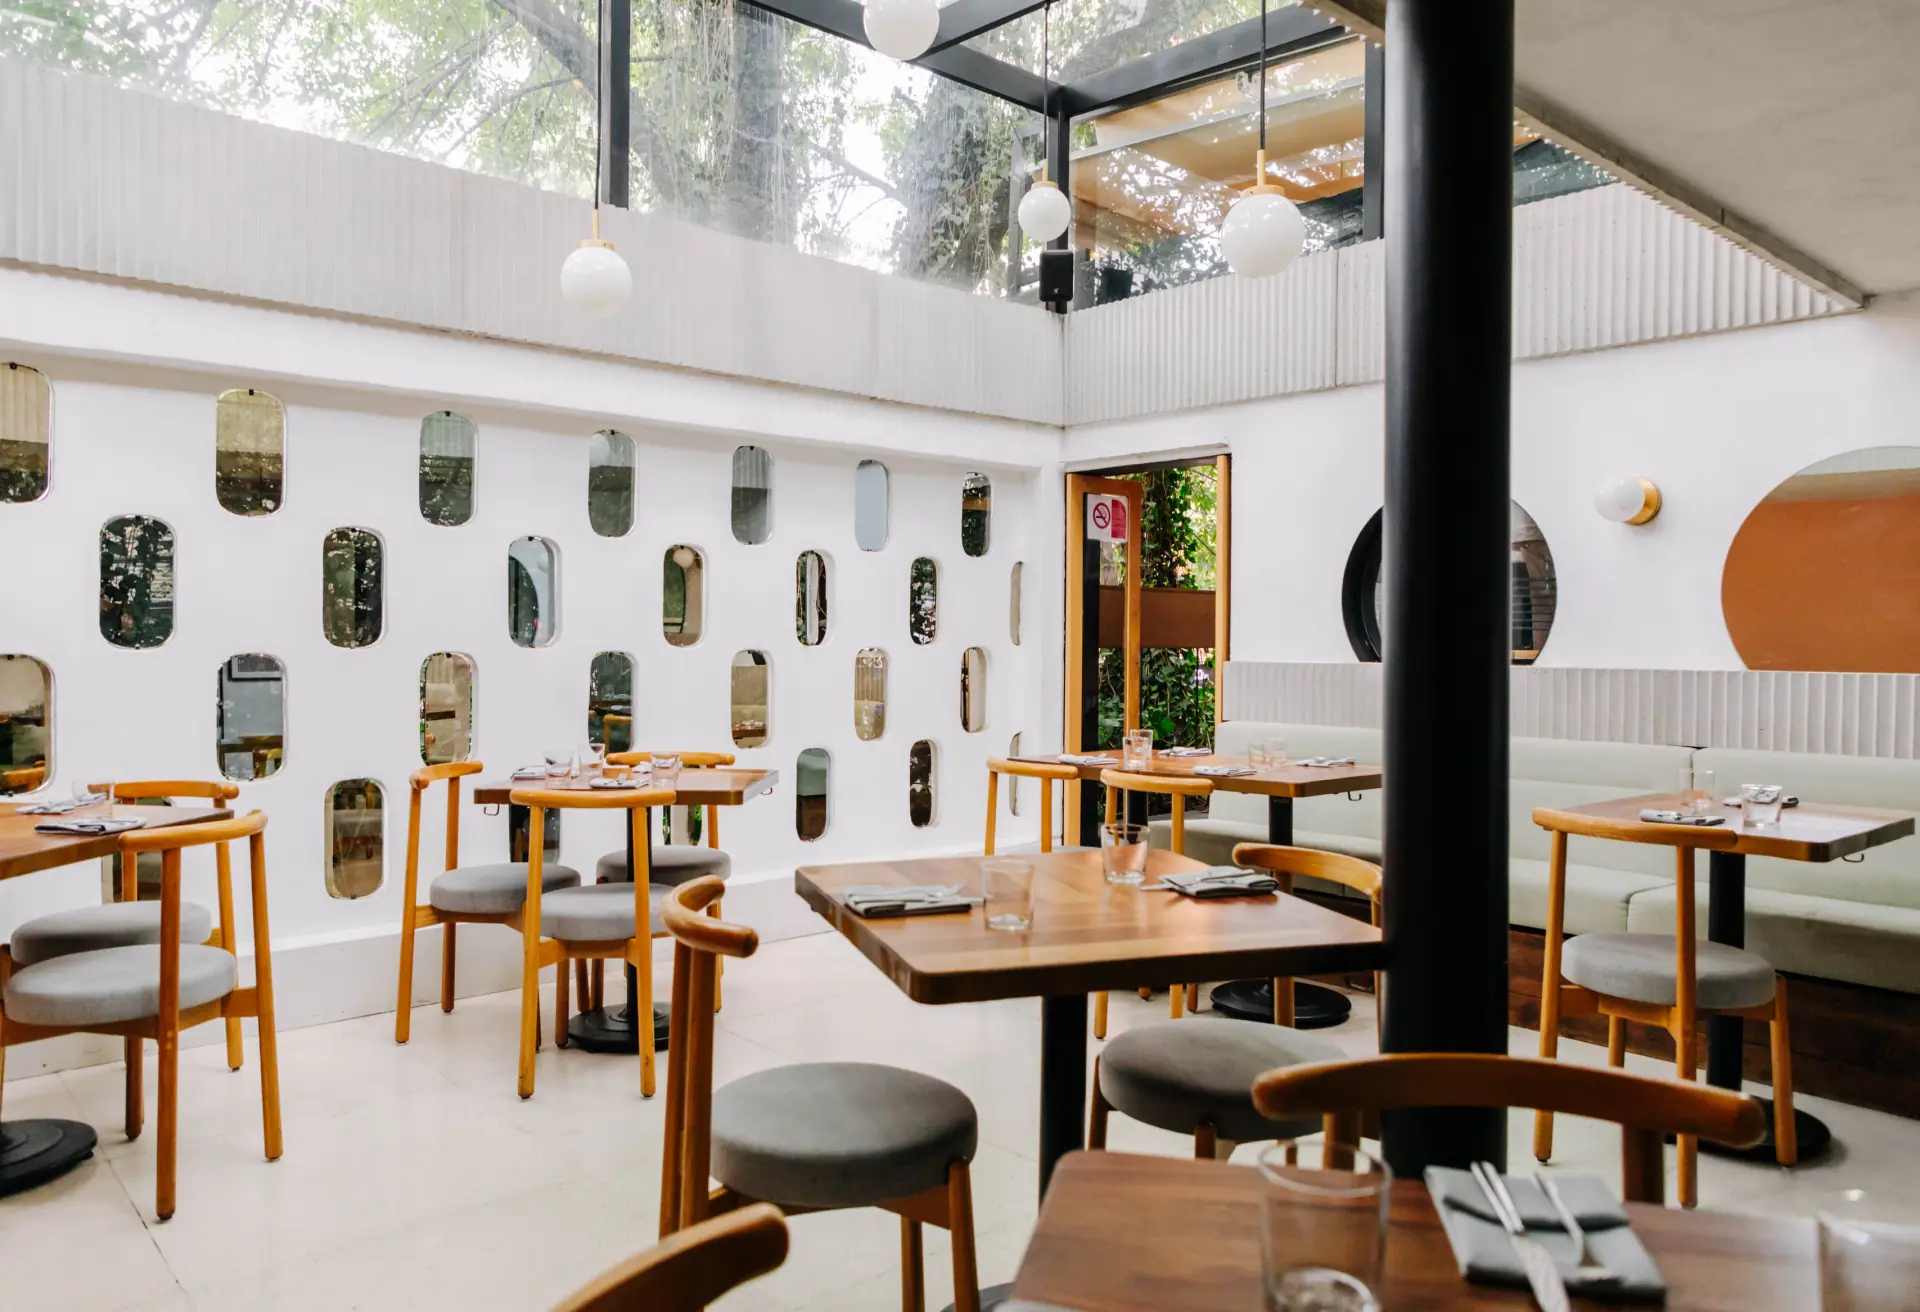
Walk into a restaurant today, and you’re not just entering a dining room. You’re entering a media studio. Every surface, every light fixture, every plate is a potential frame for a social media post. But in 2026, the rules have shifted. The neon signs and fake greenery that defined “Instagrammable” design for years are giving way to something more enduring: spaces that photograph beautifully because they’re authentic, not because they’re designed for a thumbnail.

Here’s how to build a restaurant that works in person and on screen.

The Numbers: Why Design Matters More Than Ever

OpenTable’s recent polling of diners reveals a clear mandate: 58% of diners deem a restaurant’s “Instagram/TikTok worthiness” as important, with 25% saying it’s extremely important. Nearly half (48%) say cozy, local charm is the most appealing interior style, and 54% are willing to pay a premium for a unique vibe.

But here’s the nuance. The Boston Globe reports that diners are experiencing “aesthetic fatigue.” When every restaurant looks like a stage set, nothing feels special. Guests are more cost-conscious and intentional, choosing restaurants that feel personal and authentic rather than performative.

The winning formula isn’t “designed for Instagram.” It’s “designed so well that Instagram loves it.”

The Front of House: Creating Shareable Moments

Entry and First Impressions

The entrance is your handshake. It’s also the first photo opportunity. A strong entry, whether through dramatic lighting, a distinctive door, or a striking material change, signals that this space was designed with intention. This is where the “journey” begins, and it’s where many guests will take their first photo.

The “Third Place” Quality

OpenTable found that 40% of diners consider restaurants, cafes, or bars to be their dedicated “third place” after home and work. This means your design must support lingering. Comfortable seating, varied lighting zones (bright for lunch, dim for dinner), and spaces that work for solo diners, couples, and groups all contribute to this feeling.

The Bathroom Paradox

Here’s a surprising design truth: bathrooms matter enormously. OpenTable’s poll found that 21% of restaurateurs are emphasizing “Instagrammable” bathrooms. Libby Slader, a branding and design firm owner, told the Boston Globe: “We’re still making sure that bathrooms either meet the design or even exceed the design in the restaurant. People really associate the bathroom with the cleanliness and the thought and the detail of the kitchen”.

A thoughtful bathroom, good lighting, interesting materials, a distinctive mirror, becomes a natural selfie spot. More importantly, it signals that attention to detail extends everywhere.

The Acoustic Layer: Designing for Conversation

A beautiful restaurant that’s too loud to talk in is a failure. Noise is consistently cited as one of the most irritating aspects of dining out, with 24% of customers ranking it as their top complaint. The financial impact is real: 80% of surveyed diners reported leaving a restaurant or cafe because of noise, and 91% said they would not return to places where noise levels were very high.

The Science of Sound

Research shows that customers begin to be disturbed by noise at 52 dB(A) and begin raising their voices at 57 dB(A). The willingness to spend time and money decreases starting at 52 dB(A). This triggers the Lombard effect: as ambient noise rises, people speak louder, which raises noise further, creating a stressful feedback loop.

Practical Acoustic Solutions

The Väla Centrum food court renovation offers a model. The design team used extensive acoustic wood wool cladding to reduce sound reflections in the human voice range, making the restaurant area “tranquil and homely”. The materials serve double duty: they improve acoustics while creating visual texture and pattern.

Table Spacing as a Design Tool

An analytical model published in Applied Acoustics demonstrates that proper table spacing can directly attenuate the Lombard effect. The model helps architects calculate minimum distances between tables based on room parameters. For intimate, higher-end concepts, greater spacing isn’t just about comfort, it’s about enabling conversation at normal voice levels, which directly supports higher per-person spending.

The Operational Backbone: Kitchen Workflow

Great design isn’t just what guests see. It’s what they don’t see: a kitchen that works.

Layout Fundamentals

An effective restaurant kitchen layout supports speed, safety, and consistency. The most common configurations include assembly line layouts for high-volume concepts, zone layouts for diverse menus, and galley layouts for narrow spaces.

Key Workstations

Every kitchen needs clear zones: prep stations, cooking stations, plating or pass stations, wash areas, and storage zones. Proper placement of these stations limits cross-traffic and supports a smooth production flow. For fast-casual concepts, linear movement from cooking to assembly to pickup, with minimal cross-traffic between stations, is essential.

Staff Safety

Clear walkways, separation of raw and cooked food paths, and strategic placement of handwashing sinks aren’t just code requirements, they’re design features that affect your team’s ability to work efficiently. Reducing manual handling tasks through automation (like integrated oil management systems) helps protect staff while keeping kitchens running smoothly.

The Professional Approach: Operational Design

The most sophisticated restaurant projects now integrate operational planning from the very first design phase. S&S Studio, a firm launched in late 2025, specializes in what they call “Operational Design”, bridging the gap between space design, brand identity, and daily operations.

This approach considers flow management, kitchen and bar technical design, customer journey mapping, and visual identity as a single, integrated system. The goal: minimize the discrepancy between the original creative intent and the day-to-day reality of running the restaurant.

Budgeting Reality

For restaurant owners planning new locations or renovations, design fees typically range from 50-80 yuan per square meter for mid-tier service to 80-300 yuan for comprehensive full-service design. For full-service projects, design fees generally account for 5-10% of total project costs, with higher percentages for more complex, high-end concepts.

The return on this investment is measurable. Industry data suggests that for every 1 yuan invested in design, the brand value return can be 3-5 yuan. More directly, well-designed spaces see improved staff efficiency (reducing unnecessary movement by up to 30%), higher customer satisfaction, and increased willingness to pay premium prices.

The Bottom Line

Restaurant design in 2026 is a balancing act. It must create “Instagrammable” moments without feeling performative. It must be quiet enough for conversation without feeling empty. It must look beautiful on screen while functioning flawlessly off screen.

The restaurants that succeed aren’t chasing trends. They’re building spaces rooted in authenticity, operational intelligence, and genuine hospitality. The photos will follow.

The post Restaurant Interior Design: Creating Spaces People Want to Photograph appeared first on Designer Daily: graphic and web design blog.


Restaurant Interior Design: Creating Spaces People Want to Photograph

Post pobrano z: Restaurant Interior Design: Creating Spaces People Want to Photograph

Walk into a restaurant today, and you’re not just entering a dining room. You’re entering a media studio. Every surface, every light fixture, every plate is a potential frame for a social media post. But in 2026, the rules have shifted. The neon signs and fake greenery that defined “Instagrammable” design for years are giving way to something more enduring: spaces that photograph beautifully because they’re authentic, not because they’re designed for a thumbnail.

Here’s how to build a restaurant that works in person and on screen.

The Numbers: Why Design Matters More Than Ever

OpenTable’s recent polling of diners reveals a clear mandate: 58% of diners deem a restaurant’s “Instagram/TikTok worthiness” as important, with 25% saying it’s extremely important. Nearly half (48%) say cozy, local charm is the most appealing interior style, and 54% are willing to pay a premium for a unique vibe.

But here’s the nuance. The Boston Globe reports that diners are experiencing “aesthetic fatigue.” When every restaurant looks like a stage set, nothing feels special. Guests are more cost-conscious and intentional, choosing restaurants that feel personal and authentic rather than performative.

The winning formula isn’t “designed for Instagram.” It’s “designed so well that Instagram loves it.”

The Front of House: Creating Shareable Moments

Entry and First Impressions

The entrance is your handshake. It’s also the first photo opportunity. A strong entry, whether through dramatic lighting, a distinctive door, or a striking material change, signals that this space was designed with intention. This is where the “journey” begins, and it’s where many guests will take their first photo.

The “Third Place” Quality

OpenTable found that 40% of diners consider restaurants, cafes, or bars to be their dedicated “third place” after home and work. This means your design must support lingering. Comfortable seating, varied lighting zones (bright for lunch, dim for dinner), and spaces that work for solo diners, couples, and groups all contribute to this feeling.

The Bathroom Paradox

Here’s a surprising design truth: bathrooms matter enormously. OpenTable’s poll found that 21% of restaurateurs are emphasizing “Instagrammable” bathrooms. Libby Slader, a branding and design firm owner, told the Boston Globe: “We’re still making sure that bathrooms either meet the design or even exceed the design in the restaurant. People really associate the bathroom with the cleanliness and the thought and the detail of the kitchen”.

A thoughtful bathroom, good lighting, interesting materials, a distinctive mirror, becomes a natural selfie spot. More importantly, it signals that attention to detail extends everywhere.

The Acoustic Layer: Designing for Conversation

A beautiful restaurant that’s too loud to talk in is a failure. Noise is consistently cited as one of the most irritating aspects of dining out, with 24% of customers ranking it as their top complaint. The financial impact is real: 80% of surveyed diners reported leaving a restaurant or cafe because of noise, and 91% said they would not return to places where noise levels were very high.

The Science of Sound

Research shows that customers begin to be disturbed by noise at 52 dB(A) and begin raising their voices at 57 dB(A). The willingness to spend time and money decreases starting at 52 dB(A). This triggers the Lombard effect: as ambient noise rises, people speak louder, which raises noise further, creating a stressful feedback loop.

Practical Acoustic Solutions

The Väla Centrum food court renovation offers a model. The design team used extensive acoustic wood wool cladding to reduce sound reflections in the human voice range, making the restaurant area “tranquil and homely”. The materials serve double duty: they improve acoustics while creating visual texture and pattern.

Table Spacing as a Design Tool

An analytical model published in Applied Acoustics demonstrates that proper table spacing can directly attenuate the Lombard effect. The model helps architects calculate minimum distances between tables based on room parameters. For intimate, higher-end concepts, greater spacing isn’t just about comfort, it’s about enabling conversation at normal voice levels, which directly supports higher per-person spending.

The Operational Backbone: Kitchen Workflow

Great design isn’t just what guests see. It’s what they don’t see: a kitchen that works.

Layout Fundamentals

An effective restaurant kitchen layout supports speed, safety, and consistency. The most common configurations include assembly line layouts for high-volume concepts, zone layouts for diverse menus, and galley layouts for narrow spaces.

Key Workstations

Every kitchen needs clear zones: prep stations, cooking stations, plating or pass stations, wash areas, and storage zones. Proper placement of these stations limits cross-traffic and supports a smooth production flow. For fast-casual concepts, linear movement from cooking to assembly to pickup, with minimal cross-traffic between stations, is essential.

Staff Safety

Clear walkways, separation of raw and cooked food paths, and strategic placement of handwashing sinks aren’t just code requirements, they’re design features that affect your team’s ability to work efficiently. Reducing manual handling tasks through automation (like integrated oil management systems) helps protect staff while keeping kitchens running smoothly.

The Professional Approach: Operational Design

The most sophisticated restaurant projects now integrate operational planning from the very first design phase. S&S Studio, a firm launched in late 2025, specializes in what they call “Operational Design”, bridging the gap between space design, brand identity, and daily operations.

This approach considers flow management, kitchen and bar technical design, customer journey mapping, and visual identity as a single, integrated system. The goal: minimize the discrepancy between the original creative intent and the day-to-day reality of running the restaurant.

Budgeting Reality

For restaurant owners planning new locations or renovations, design fees typically range from 50-80 yuan per square meter for mid-tier service to 80-300 yuan for comprehensive full-service design. For full-service projects, design fees generally account for 5-10% of total project costs, with higher percentages for more complex, high-end concepts.

The return on this investment is measurable. Industry data suggests that for every 1 yuan invested in design, the brand value return can be 3-5 yuan. More directly, well-designed spaces see improved staff efficiency (reducing unnecessary movement by up to 30%), higher customer satisfaction, and increased willingness to pay premium prices.

The Bottom Line

Restaurant design in 2026 is a balancing act. It must create “Instagrammable” moments without feeling performative. It must be quiet enough for conversation without feeling empty. It must look beautiful on screen while functioning flawlessly off screen.

The restaurants that succeed aren’t chasing trends. They’re building spaces rooted in authenticity, operational intelligence, and genuine hospitality. The photos will follow.

The post Restaurant Interior Design: Creating Spaces People Want to Photograph appeared first on Designer Daily: graphic and web design blog.